Quick Answer
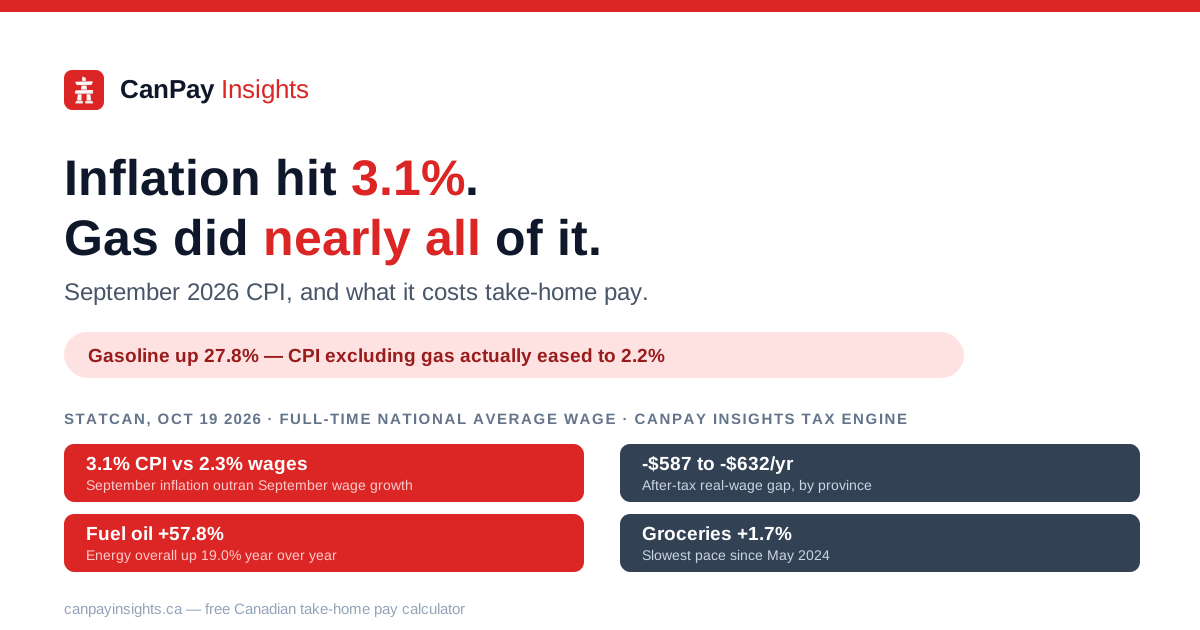
Canada's Consumer Price Index rose 3.1% year over year in September 2026, Statistics Canada reported on October 19, 2026, up from 3.0% in August and driven mainly by a 27.8% jump in gasoline prices. Inflation excluding gasoline actually eased, to 2.2% from 2.4%. Against September's 2.3% wage growth, a full-time worker on the national average wage is now losing roughly $587 to $632 a year in after-tax purchasing power, depending on province.
Gasoline did nearly all of the damage
Statistics Canada's Consumer Price Index for September 2026, released October 19, 2026, puts headline inflation at 3.1% year over year, up from 3.0% in August — the second straight monthly acceleration. Prices rose 0.1% month over month, or 0.4% on a seasonally adjusted basis.
Key facts
- Headline CPI rose 3.1% year over year, up from 3.0% in August.
- Gasoline jumped 27.8% year over year, up from 22.8% in August — the single biggest driver of the acceleration.
- Energy overall rose 19.0% (from 15.4%), and fuel oil and other fuels rose 57.8% (from 43.7%).
- Excluding gasoline, CPI actually eased to 2.2% from 2.4% in August.
- Food purchased from stores slowed to 1.7%, its slowest pace since May 2024.
- Shelter costs rose 1.8% (from 1.5%), with rent up 2.8% (unchanged) and mortgage interest costs still down 0.2% year over year.
What got more expensive, and what didn't
| Category | September 2026 (YoY) | August 2026 (YoY) |
|---|---|---|
| Headline CPI | 3.1% | 3.0% |
| CPI excluding gasoline | 2.2% | 2.4% |
| Gasoline | +27.8% | +22.8% |
| Energy (all) | +19.0% | +15.4% |
| Fuel oil & other fuels | +57.8% | +43.7% |
| Shelter | +1.8% | +1.5% |
| Rent | +2.8% | +2.8% |
| Mortgage interest cost | -0.2% | -0.2% |
| Food purchased from stores | +1.7% | +2.8% |
The pattern is clear: almost everything tied to oil and fuel got sharply more expensive, while the rest of the basket — including groceries — kept cooling. That is why the headline number rose even as the "excluding gasoline" measure StatCan highlights fell.
What September's inflation is costing your paycheque
Statistics Canada's Labour Force Survey for September, released October 9, 2026, put average hourly wage growth at 2.3% year over year — 0.8 percentage points behind this inflation reading. On October 12, CanPay Insights ran that wage data through the CanPay tax engine using August's 3.0% CPI as a stand-in for September, since the real number was not out yet. Now that it is, here is the same calculation with the actual number: September's CPI came in at 3.1%. The table below uses that figure for a full-time worker (2,080 hours/year) on the national average wage ($36.78/hour in September 2025, $37.64/hour in September 2026) in every province, holding 2026 federal and provincial tax rates, CPP/CPP2, and EI constant throughout so only the wage changes:
| Province | Take-home, Sept 2026 | Nominal after-tax gain | Needed to match 3.1% inflation | Real (after-inflation) gap |
|---|---|---|---|---|
| Nunavut | $61,110 | +$1,245 | $61,721 | -$611 |
| Northwest Territories | $60,003 | +$1,217 | $60,608 | -$605 |
| British Columbia | $59,979 | +$1,233 | $60,567 | -$588 |
| Yukon | $59,883 | +$1,211 | $60,491 | -$608 |
| Alberta | $59,557 | +$1,193 | $60,173 | -$616 |
| Ontario | $59,149 | +$1,209 | $59,736 | -$587 |
| Saskatchewan | $57,923 | +$1,151 | $58,532 | -$609 |
| New Brunswick | $57,171 | +$1,124 | $57,784 | -$613 |
| Manitoba | $57,133 | +$1,146 | $57,723 | -$590 |
| Newfoundland and Labrador | $56,790 | +$1,116 | $57,400 | -$610 |
| Prince Edward Island | $56,303 | +$1,080 | $56,935 | -$632 |
| Quebec | $55,971 | +$1,090 | $56,582 | -$611 |
| Nova Scotia | $55,408 | +$1,079 | $56,013 | -$605 |
This is illustrative: it assumes a full year's household budget inflates at the headline CPI rate, which will not match every worker's actual spending — someone who drives a lot felt September harder than someone who doesn't. The "needed" column is each province's September 2025 take-home pay multiplied by 1.031, the actual CPI reading; the gap is the actual September 2026 take-home pay minus that figure.
A gap wider than first estimated
The real-wage shortfall now runs from -$587 in Ontario to -$632 in Prince Edward Island, compared with the -$529 to -$577 range CanPay Insights published on October 12 using August's 3.0% rate as a placeholder for September. The difference — roughly $55 to $60 a year, depending on province — is exactly what you'd expect from inflation coming in a tenth of a point hotter than assumed (3.1% actual versus 3.0% assumed) while wage growth held at 2.3%. It is a small revision, but it moves in one direction only: worse for take-home pay, not better.
The last data point before the Bank of Canada's October decision
September's CPI, released October 19, 2026, is the final inflation reading the Bank of Canada will see before its October 28, 2026 interest rate announcement — the next CPI report is not due until mid-November. This article reports the inflation data and what it costs take-home pay; it does not forecast what the Bank of Canada will do with it.
What it means for your own paycheque
The 3.1% figure is a national average across every household's actual spending — if you drive often or heat with oil, September likely cost you more than that; if you don't, less. If a raise or new offer is in front of you, run the real numbers through the free CanPay Insights salary calculator to see what it is worth after federal tax, provincial tax, CPP, and EI, or use compare provinces to see how the same salary lands somewhere else. For the wage and jobs data behind September's real-wage estimate, see wages grew 2.3% in September 2026. CPP and EI deduction rates for 2026 are covered in how much CPP you'll pay in 2026 and how much EI you'll pay in 2026.
Sources & disclaimer
Inflation figures are from Statistics Canada's Consumer Price Index, September 2026, released October 19, 2026. Wage and employment figures are from Statistics Canada's Labour Force Survey, September 2026, released October 9, 2026. Take-home pay figures are calculated with the CanPay Insights tax engine using 2026 federal and provincial tax brackets, CPP/CPP2 (QPP/QPP2 and QPIP for Quebec), and EI premiums, for a single full-time worker (2,080 hours/year) with basic personal amounts only — real paycheques vary with credits, benefits, RRSP contributions, and actual hours worked. This is general information, not financial or tax advice.
Calculate Your Take-Home Pay
Enter your salary and province to see detailed tax breakdowns instantly.
Use Free CalculatorFrequently Asked Questions
What is Canada's inflation rate for September 2026?⌄
Why did inflation accelerate in September?⌄
Is underlying inflation getting worse, or is this just gas prices?⌄
How much is September's inflation costing my paycheque?⌄
Does this affect the Bank of Canada's October 28 interest rate decision?⌄
Share this article
Help others learn about Canadian taxes
Disclaimer: This content is based on publicly available information and general tax knowledge for reference only. Individual tax situations may vary. Please consult a qualified tax professional or accountant for personalized advice.