Quick Answer
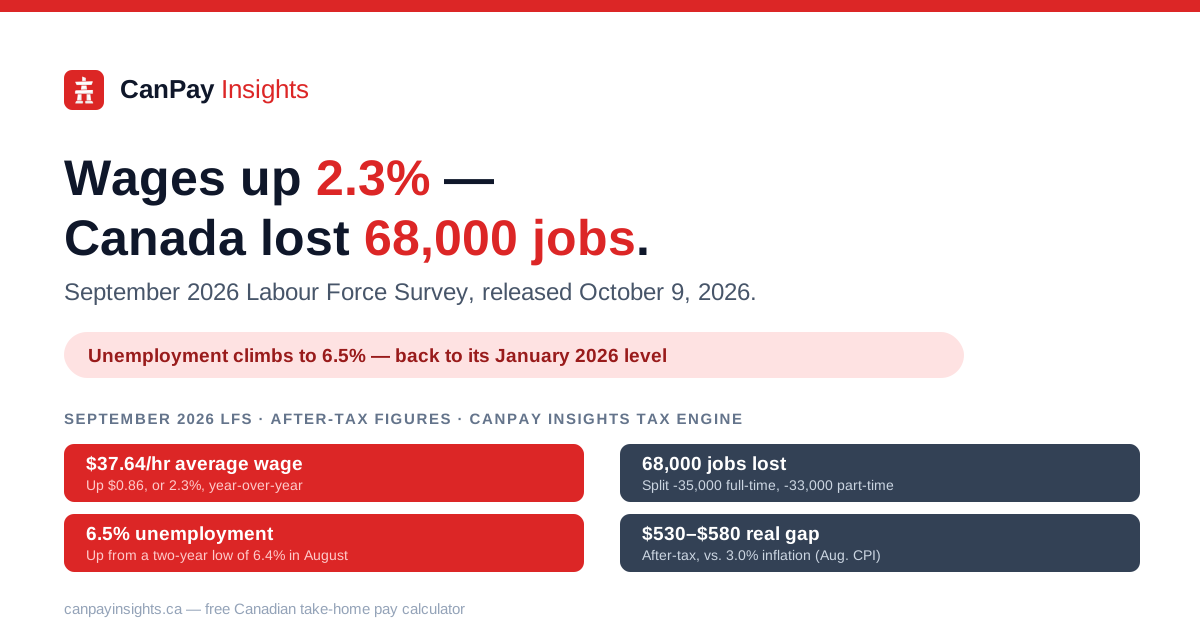
Canadian wages grew 2.3% year-over-year in September 2026 — up from 2.0% in August — even as the economy lost 68,000 jobs, its steepest monthly drop since the spring, and the unemployment rate rose to 6.5%, back to where it stood in January. Against the most recent inflation reading of 3.0% (August 2026, the latest available), that gap works out to roughly $530 to $580 a year in lost after-tax purchasing power for a full-time worker on the national average wage, narrower than August's gap of more than $700 because wage growth sped up while inflation held flat.
A bigger raise, a weaker job market
Statistics Canada's Labour Force Survey for September 2026, released October 9, 2026, tells two different stories at once: wage growth sped up, and the job market took its worst month in a while.
Key facts
- Average hourly wages rose 2.3% year-over-year in September, to $37.64 (up $0.86) — faster than August's 2.0%, though still below June's 3.3% and July's 2.8%.
- Employment fell by 68,000 (-0.3%), split almost evenly between full-time (-35,000) and part-time (-33,000) work. Economists had forecast a small gain of roughly 9,000 jobs.
- The unemployment rate rose to 6.5%, up from a two-year low of 6.4% in July and August, and back to its January 2026 level. It remains below April's recent peak of 6.9%.
- The employment rate fell to 60.6% (a second straight monthly decline) and the participation rate fell to 64.8%, its lowest level outside 2020 since December 1997.
- The public sector lost 70,000 jobs, a fourth straight monthly decline.
- Losses were concentrated in Quebec (-49,000), BC (-20,000), and Ontario (-20,000), while Alberta (+23,000) and the Atlantic provinces of Newfoundland and Labrador (+1,800) and PEI (+1,000) gained jobs.
Where the jobs were lost — and gained
| Province/sector | Change, September 2026 |
|---|---|
| Quebec | -49,000 (-1.1%) |
| British Columbia | -20,000 (-0.7%) |
| Ontario | -20,000 (-0.2%) |
| Manitoba | -4,400 (-0.6%) |
| Alberta | +23,000 (+0.9%) |
| Newfoundland and Labrador | +1,800 (+0.7%) |
| Prince Edward Island | +1,000 (+1.0%) |
| Educational services | -35,000 (-2.2%) |
| Health care & social assistance | -23,000 (-0.8%, first drop since Dec. 2022) |
| Manufacturing | -13,000 (-0.7%) |
| Self-employment | -23,000 (-0.8%) |
| Other services | +17,000 (+2.1%) |
KPMG economist Daniel Hyun cautioned it would be premature to blame the losses on U.S. tariffs, since most came from non-trade-facing sectors like education, health care, and public administration. The report was the Bank of Canada's last look at the labour market before its October 28, 2026 interest-rate decision.
What the faster raise is worth after tax
Since September's Consumer Price Index will not be released until October 19, 2026, the most recent available inflation reading is August's 3.0% year-over-year — unchanged from July. Using that as a stand-in for September, we ran the national average hourly wage (September 2025: $36.78; September 2026: $37.64) through the CanPay Insights tax engine for a full-time worker (2,080 hours/year) in every province, using 2026 federal and provincial tax rates, CPP/CPP2, and EI throughout, to isolate the wage effect from any tax-rate change.
| Province | Take-home Sep 2025 | Take-home Sep 2026 | Nominal after-tax gain | Needed to match 3.0% inflation | Real (after-inflation) gap |
|---|---|---|---|---|---|
| Nunavut | $59,865 | $61,110 | +$1,245 | $61,660 | -$551 |
| Northwest Territories | $58,786 | $60,003 | +$1,218 | $60,549 | -$546 |
| British Columbia | $58,746 | $59,979 | +$1,233 | $60,509 | -$529 |
| Yukon | $58,672 | $59,883 | +$1,211 | $60,432 | -$549 |
| Alberta | $58,364 | $59,557 | +$1,193 | $60,115 | -$557 |
| Ontario | $57,940 | $59,149 | +$1,208 | $59,679 | -$530 |
| Saskatchewan | $56,772 | $57,923 | +$1,151 | $58,475 | -$553 |
| New Brunswick | $56,047 | $57,171 | +$1,125 | $57,728 | -$557 |
| Manitoba | $55,987 | $57,133 | +$1,146 | $57,667 | -$533 |
| Newfoundland and Labrador | $55,674 | $56,790 | +$1,116 | $57,344 | -$554 |
| Prince Edward Island | $55,223 | $56,303 | +$1,080 | $56,880 | -$577 |
| Quebec | $54,881 | $55,971 | +$1,090 | $56,527 | -$556 |
| Nova Scotia | $54,329 | $55,408 | +$1,079 | $55,959 | -$551 |
The real gap narrowed from August's roughly $714–$748 shortfall (national average wage) to about $529–$577 in September, because wage growth sped up from 2.0% to 2.3% while inflation held flat at 3.0%. This is illustrative: it assumes a full year's household budget inflates at the headline CPI rate, which will not match every worker's actual spending, and September's actual CPI print (due October 19, 2026) could land above or below 3.0%.
A report with two different headlines
- Hiring stalled hard. September's 68,000-job drop followed a 41,700-job drop in August — the steepest two-month stretch of losses since the spring, and a clear miss against a forecast gain.
- The public sector kept shedding jobs. Down 70,000 in September, the fourth consecutive monthly decline, with education and health care — normally stable public-sector fields — posting their first notable drops in years.
- But the raises got a little bigger. Wage growth accelerated for the first time in three months, from June's 3.3% down to August's 2.0%, then back up to 2.3% in September.
What it means for your own paycheque
The 2.3% figure is a national average across every wage level, industry, and province — it is not any one person's raise, and a weaker job market can make it harder to negotiate for more. If you are weighing a raise, a new offer, or the risk of a layoff, run the real numbers through the free CanPay Insights salary calculator to see what it is actually worth after federal tax, provincial tax, CPP, and EI, or use compare provinces to see how the same salary lands somewhere else. If a layoff is a real possibility, the temporary EI relief measures — including a waived one-week waiting period and extra weeks for long-tenured workers — were extended into 2027. CPP and EI deduction rates for 2026 are covered in how much CPP you'll pay in 2026 and how much EI you'll pay in 2026. The August 2026 edition of this real-wage series, with that month's province-by-province figures, is available here.
Sources & disclaimer
Wage and employment figures, including the provincial and sector breakdowns, are from Statistics Canada's Labour Force Survey, September 2026, released October 9, 2026. The 3.0% inflation figure is from Statistics Canada's Consumer Price Index, August 2026, released September 14, 2026 — the most recent CPI reading available as of publication, since the September 2026 CPI is not due until October 19, 2026. Take-home pay figures are calculated with the CanPay Insights tax engine using 2026 federal and provincial tax brackets, CPP/CPP2 (QPP/QPP2 and QPIP for Quebec), and EI premiums, for a single full-time worker (2,080 hours/year) with basic personal amounts only — real paycheques vary with credits, benefits, RRSP contributions, and actual hours worked. This is general information, not financial or tax advice.
Calculate Your Take-Home Pay
Enter your salary and province to see detailed tax breakdowns instantly.
Use Free CalculatorFrequently Asked Questions
How much did Canadian wages grow in September 2026?⌄
What happened to jobs and unemployment in September 2026?⌄
Where were the September 2026 job losses concentrated?⌄
How does September wage growth compare to inflation?⌄
Is 6.5% unemployment a multi-year high?⌄
Where do these figures come from?⌄
Share this article
Help others learn about Canadian taxes
Disclaimer: This content is based on publicly available information and general tax knowledge for reference only. Individual tax situations may vary. Please consult a qualified tax professional or accountant for personalized advice.