Quick Answer
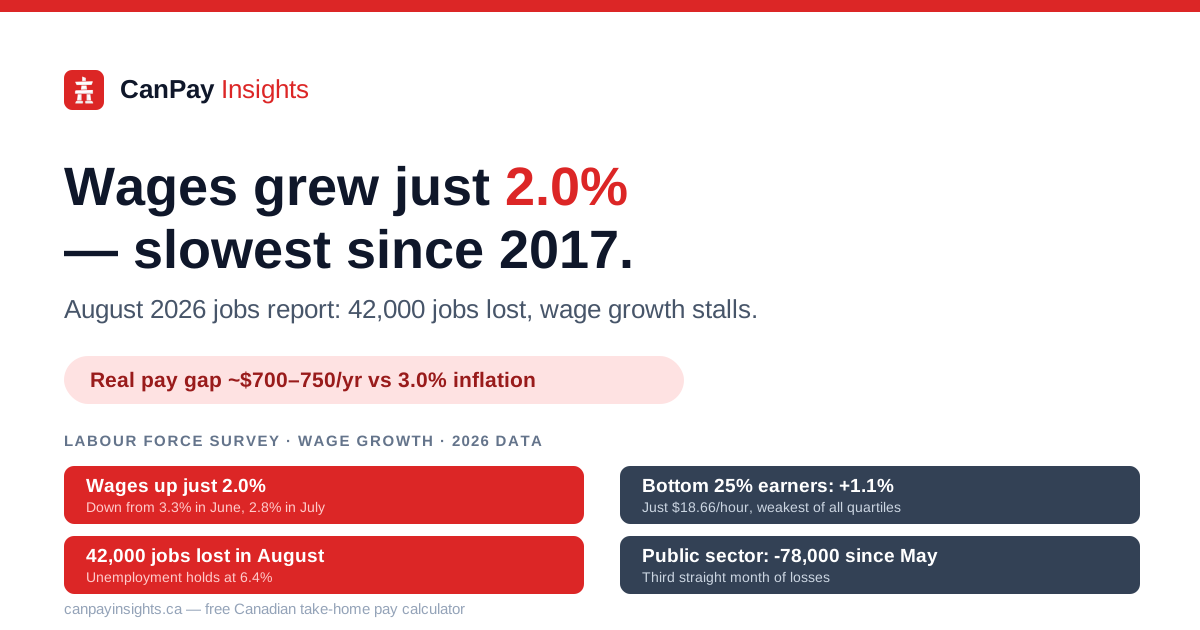
Canadian wages grew just 2.0% year-over-year in August 2026 — the slowest pace since November 2017, excluding the pandemic — as the economy shed 42,000 jobs and the unemployment rate held at 6.4%. Against the most recent inflation reading of 3.0% (July 2026, the latest available), that gap works out to roughly $700 to $750 a year in lost after-tax purchasing power for a full-time worker on the national average wage, more than double July's gap. The lowest-paid quarter of workers, earning $18.66 an hour, got the smallest raise of all four wage quartiles: just 1.1%.
Wage growth just hit a wall
Statistics Canada's Labour Force Survey for August 2026, released September 4, 2026, shows the sharpest deceleration in wage growth in years, alongside a surprise drop in employment.
Key facts
- Average hourly wages rose just 2.0% year-over-year in August, to $37.02 (up $0.71) — down from 2.8% growth in July and 3.3% in June.
- The slowest pace of wage growth since November 2017 (also 2.0%), excluding 2021's pandemic-distorted numbers, per Statistics Canada's own release.
- Employment fell by 42,000 (-0.2%), and the employment rate slipped 0.1 points to 60.8%. The unemployment rate held at 6.4%.
- Public-sector jobs fell for a third straight month — down 20,000 in August and 78,000 (-1.7%) since May.
- Youth unemployment rose 0.3 points to 12.9%, as youth employment fell 19,000 (-0.7%).
- Low-wage workers got the smallest raises. The bottom 25% of earners saw wages rise just 1.1% (to $18.66/hour); the top 25% grew 2.1% (to $65.15/hour).
Wage growth by quartile — everyone got a raise, but not the same one
| Wage quartile | Average hourly wage, Aug 2026 | Year-over-year growth |
|---|---|---|
| Bottom 25% | $18.66 | +1.1% |
| Second-lowest 25% | $26.61 | +1.3% |
| Third 25% | $37.99 | +2.1% |
| Top 25% | $65.15 | +2.1% |
The lowest-paid quarter of Canadian workers — earning under roughly $19 an hour — got barely a third of the percentage raise the top quarter did, even as the most recent inflation reading sat at 3.0%. That is the group for whom a slow raise bites hardest: minimum-wage and near-minimum-wage workers spend a larger share of every paycheque on rent, groceries, and other necessities that inflation hits directly.
What the slowdown costs after tax
Since August's Consumer Price Index will not be released until mid-September 2026, the most recent available inflation reading is July's 3.0% year-over-year. Using that as a stand-in for August, we ran the national average hourly wage (August 2025: $36.31; August 2026: $37.02) through the CanPay Insights tax engine for a full-time worker (2,080 hours/year) in every province, using 2026 federal and provincial tax rates, CPP/CPP2, and EI throughout, to isolate the wage effect from any tax-rate change.
| Province | Take-home Aug 2025 | Take-home Aug 2026 | Nominal after-tax gain | Needed to match 3.0% inflation | Real (after-inflation) gap |
|---|---|---|---|---|---|
| Nunavut | $59,184 | $60,212 | +$1,028 | $60,960 | -$748 |
| British Columbia | $58,072 | $59,090 | +$1,018 | $59,814 | -$724 |
| Northwest Territories | $58,120 | $59,125 | +$1,005 | $59,864 | -$738 |
| Yukon | $58,010 | $59,010 | +$999 | $59,751 | -$741 |
| Alberta | $57,712 | $58,697 | +$985 | $59,443 | -$746 |
| Ontario | $57,280 | $58,278 | +$997 | $58,999 | -$721 |
| Saskatchewan | $56,143 | $57,093 | +$950 | $57,828 | -$734 |
| New Brunswick | $55,432 | $56,360 | +$929 | $57,095 | -$734 |
| Manitoba | $55,360 | $56,307 | +$946 | $57,021 | -$714 |
| Newfoundland and Labrador | $55,064 | $55,986 | +$922 | $56,716 | -$730 |
| Quebec | $54,285 | $55,185 | +$900 | $55,913 | -$728 |
| Prince Edward Island | $54,633 | $55,524 | +$892 | $56,272 | -$747 |
| Nova Scotia | $53,740 | $54,630 | +$891 | $55,352 | -$721 |
If August inflation lands near July's 3.0%, the real gap for a full-time worker on the national average wage roughly doubles from July's $288–$365 shortfall to about $714–$748. This is illustrative: it assumes a full year's household budget inflates at the headline CPI rate, which will not match every worker's actual spending, and August's actual CPI print could land above or below 3.0%.
The gap by wage level, not just by province
The province table above uses the national average wage across all quartiles. Looking instead at the bottom and top wage quartiles specifically, for a full-time Ontario worker:
| Bottom 25% ($18.66/hr) | Top 25% ($65.15/hr) | |
|---|---|---|
| Take-home, Aug 2025 | $31,637 | $94,544 |
| Take-home, Aug 2026 | $31,928 | $96,121 |
| Nominal after-tax gain | +$291 | +$1,577 |
| Needed to match 3.0% inflation | $32,586 | $97,380 |
| Real (after-inflation) gap | -$658 | -$1,259 |
In raw dollars the top quartile's shortfall looks bigger, but as a share of income it is the opposite: the bottom quartile's $658 gap is about 2% of their annual take-home pay, versus roughly 1.3% for the top quartile — before accounting for the fact that lower earners spend a larger share of every dollar on necessities that are typically hit hardest by inflation.
Why hiring and raises both cooled
Three threads run through August's report:
- A public sector pullback. Public-sector employment has now fallen for three straight months, down 78,000 (-1.7%) since May — a meaningful drag after months of steady growth.
- A pause after a hot stretch. Employment had climbed a cumulative 181,000 from April through July before August's 42,000 drop, so some slowdown was arguably overdue; several economists characterized the report as confirming a broader Q3 growth slowdown rather than a one-month blip.
- Manufacturing bucked the trend. Despite ongoing tariff pressure, manufacturing added 22,000 jobs in August — a rare bright spot in an otherwise soft report.
What it means for your own paycheque
The 2.0% figure is a national average across every wage level, industry, and province — it is not any one person's raise. If you got a raise this year, or are negotiating one, run the real numbers through the free CanPay Insights salary calculator to see what it is actually worth after federal tax, provincial tax, CPP, and EI, or use compare provinces to see how the same raise lands somewhere else. CPP and EI deduction rates for 2026 are covered in how much CPP you'll pay in 2026 and how much EI you'll pay in 2026. The July 2026 edition of this real-wage series, with that month's province-by-province figures, is available here.
Sources & disclaimer
Wage and employment figures, including the wage-quartile breakdown and the "slowest since November 2017" comparison, are from Statistics Canada's Labour Force Survey, August 2026, released September 4, 2026. The 3.0% inflation figure is from Statistics Canada's Consumer Price Index, July 2026, released August 17, 2026 — the most recent CPI reading available as of publication, since the August 2026 CPI is not due until mid-September. Take-home pay figures are calculated with the CanPay Insights tax engine using 2026 federal and provincial tax brackets, CPP/CPP2 (QPP/QPP2 and QPIP for Quebec), and EI premiums, for a single full-time worker (2,080 hours/year) with basic personal amounts only — real paycheques vary with credits, benefits, RRSP contributions, and actual hours worked. This is general information, not financial or tax advice.
Calculate Your Take-Home Pay
Enter your salary and province to see detailed tax breakdowns instantly.
Use Free CalculatorFrequently Asked Questions
How much did Canadian wages grow in August 2026?⌄
How does August's wage growth compare to inflation?⌄
What happened to the job market in August 2026?⌄
Did all workers get the same size raise?⌄
Did youth employment get hit particularly hard?⌄
Where do these figures come from?⌄
Share this article
Help others learn about Canadian taxes
Disclaimer: This content is based on publicly available information and general tax knowledge for reference only. Individual tax situations may vary. Please consult a qualified tax professional or accountant for personalized advice.