Quick Answer
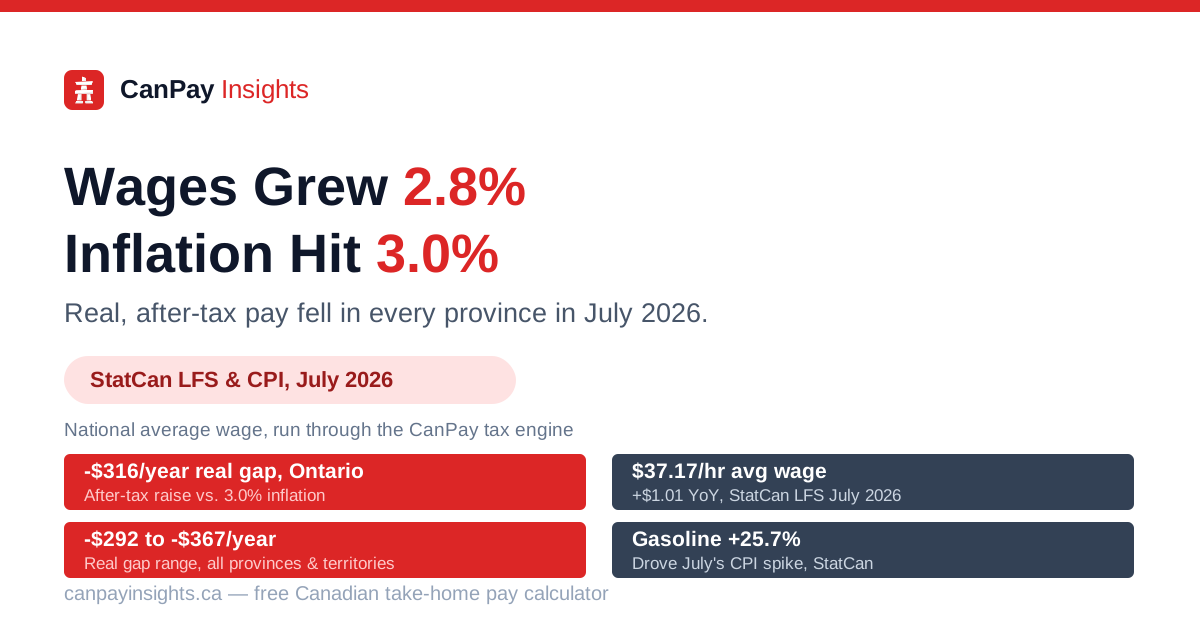
Statistics Canada's Labour Force Survey (released August 7, 2026) put average hourly wage growth at 2.8% year-over-year in July, while the Consumer Price Index (released August 17, 2026) showed inflation at 3.0% year-over-year the same month — a negative real wage gap of about 0.2 percentage points. Run through the CanPay Insights tax engine for a full-time worker earning the national average wage, that gap works out to roughly $290 to $370 a year in lost after-tax purchasing power, depending on province, with Prince Edward Island losing the most and British Columbia the least.
Wages rose 2.8%. Prices rose faster.
Two Statistics Canada releases, three weeks apart, tell a simple story about the summer of 2026: paycheques are growing, but not quite fast enough.
- August 7, 2026 — Labour Force Survey, July 2026: average hourly wages rose 2.8% year-over-year, reaching $37.17 (up $1.01 from July 2025's $36.16). That's down from 3.3% growth in June.
- August 17, 2026 — Consumer Price Index, July 2026: the CPI rose 3.0% year-over-year, up from 2.8% in June — driven mainly by a 25.7% year-over-year jump in gasoline prices. Core inflation excluding gasoline held at 2.2% for a third straight month, and grocery inflation actually eased to 3.1% from 3.9%.
Subtract one from the other and July 2026 posted a negative real wage gap of about 0.2 percentage points — the average Canadian paycheque grew, but slightly slower than the cost of living did. We ran the national average wage through the CanPay Insights tax engine to see exactly what that gap is worth after tax, in every province.
Key findings
- A full-time worker on the national average wage gained $2,101 in gross pay year-over-year (2,080 hours × $1.01/hour) — but needed 3.0% more just to stand still against inflation.
- After tax, every province and territory came up short. The real (inflation-adjusted) gap ranged from about -$288 a year in British Columbia to -$365 a year in Prince Edward Island.
- In Ontario, take-home pay for that same worker rose from $57,070 to $58,488 — a $1,419 raise after tax, but about $293 short of matching inflation.
- Gasoline, not groceries, drove July's inflation. Grocery price growth actually slowed for a fourth straight month, while pump prices did the damage.
What "real wage growth" costs, province by province
Figures use Statistics Canada's national average hourly wage (July 2025: $36.16; July 2026: $37.17) at full-time hours (2,080/year), run through the CanPay Insights tax engine with 2026 federal and provincial rates, CPP/CPP2, and EI. "Needed to match inflation" is July 2025 take-home pay multiplied by 1.03, the same CPI figure StatCan reported for July 2026.
| Province | Take-home July 2025 | Take-home July 2026 | Nominal after-tax gain | Needed to match 3.0% inflation | Real (after-inflation) gap |
|---|---|---|---|---|---|
| British Columbia | $57,857 | $59,305 | +$1,448 | $59,593 | -$288 |
| Ontario | $57,070 | $58,488 | +$1,419 | $58,782 | -$293 |
| Nunavut | $58,967 | $60,429 | +$1,462 | $60,736 | -$307 |
| Northwest Territories | $57,908 | $59,338 | +$1,430 | $59,645 | -$307 |
| Manitoba | $55,161 | $56,507 | +$1,346 | $56,815 | -$309 |
| Yukon | $57,799 | $59,221 | +$1,422 | $59,533 | -$312 |
| Alberta | $57,503 | $58,905 | +$1,402 | $59,229 | -$323 |
| Saskatchewan | $55,943 | $57,294 | +$1,351 | $57,621 | -$327 |
| Newfoundland and Labrador | $54,869 | $56,180 | +$1,311 | $56,516 | -$335 |
| New Brunswick | $55,236 | $56,557 | +$1,321 | $56,893 | -$336 |
| Nova Scotia | $53,551 | $54,819 | +$1,267 | $55,158 | -$339 |
| Quebec | $54,095 | $55,375 | +$1,280 | $55,717 | -$342 |
| Prince Edward Island | $54,444 | $55,713 | +$1,269 | $56,078 | -$365 |
"Needed to match 3.0% inflation" is illustrative: it assumes the whole household budget inflates at the headline CPI rate, which will not match every worker's actual spending. Provinces with higher after-tax pay (and therefore higher nominal dollar increases) tend to show a slightly larger real-dollar gap even at the same 3.0% shortfall, because 3% of a bigger number is a bigger number.
Why the gap opened up
Three things moved in opposite directions at once in July:
- Hiring stayed strong, but raises cooled. StatCan's Labour Force Survey showed 75,000 net new jobs in July and unemployment easing to 6.4% — a healthy jobs market — but wage growth slowed from 3.3% in June to 2.8% in July.
- Gasoline did the damage on the price side. Pump prices were up 25.7% year-over-year in July, accelerating from 20.5% in June, and pulled headline CPI up to 3.0% — matching the top of the Bank of Canada's target range.
- Everything else was calmer. Core inflation excluding gasoline held at 2.2%, and grocery price growth kept slowing (3.1% in July, down from 3.9% in June). The gap between wages and prices in July 2026 was mostly a gas-price story, not a broad cost-of-living surge.
What it means for your own paycheque
The national average wage is exactly that — an average. Your own raise, tax bracket, province, and pay frequency will all move these numbers. If you got a raise this year, or are negotiating one, run your real numbers through the free CanPay Insights salary calculator to see what it's actually worth after federal tax, provincial tax, CPP, and EI, or use compare provinces to see how the same raise lands in a different province. CPP and EI deduction rates are covered in detail in how much CPP you'll pay in 2026 and how much EI you'll pay in 2026.
Sources & disclaimer
Wage and employment figures are from Statistics Canada's Labour Force Survey, July 2026, released August 7, 2026. Inflation figures are from Statistics Canada's Consumer Price Index, July 2026, released August 17, 2026. Take-home pay figures are calculated with the CanPay Insights tax engine using 2026 federal and provincial tax brackets, CPP/CPP2 (QPP/QPP2 and QPIP for Quebec), and EI premiums, for a single full-time worker (2,080 hours/year) with basic personal amounts only — real paycheques vary with credits, benefits, RRSP contributions, and actual hours worked. This is general information, not financial or tax advice.
Calculate Your Take-Home Pay
Enter your salary and province to see detailed tax breakdowns instantly.
Use Free CalculatorFrequently Asked Questions
Did Canadian wages keep pace with inflation in July 2026?⌄
How much did inflation cost an Ontario worker's raise, after tax?⌄
Which province had the smallest and largest real pay gap?⌄
Why did wage growth slow down while inflation sped up in July 2026?⌄
Is national average wage growth the same as my own raise?⌄
Where do these figures come from?⌄
Share this article
Help others learn about Canadian taxes
Disclaimer: This content is based on publicly available information and general tax knowledge for reference only. Individual tax situations may vary. Please consult a qualified tax professional or accountant for personalized advice.