Quick Answer
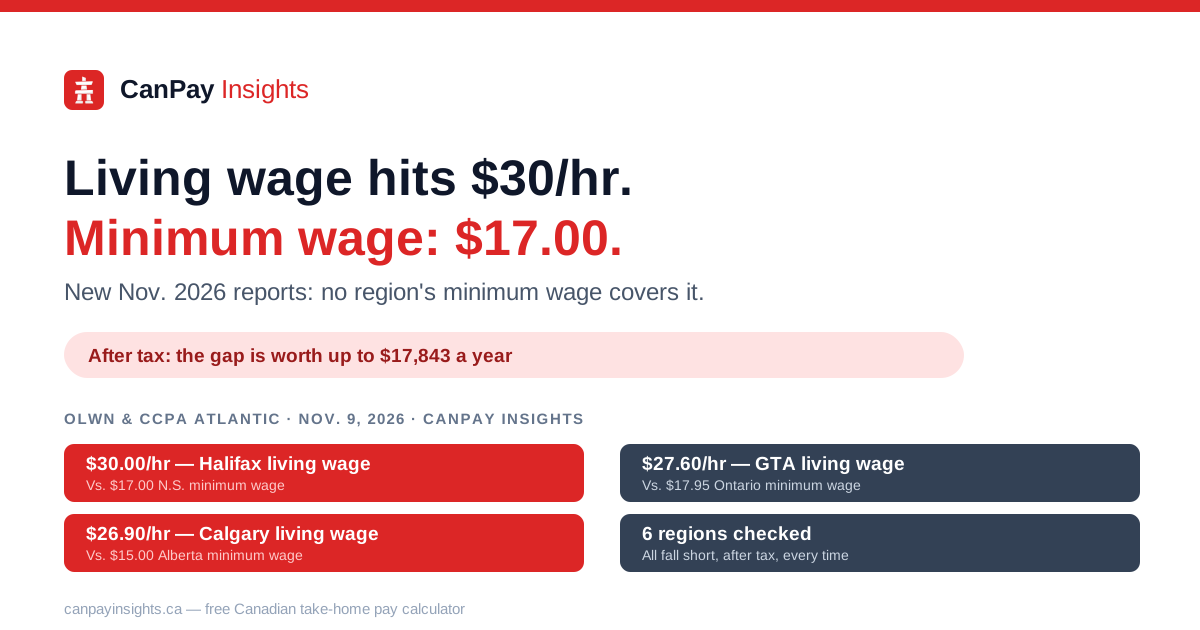
In the first three weeks of November 2026, four living-wage research networks released updated 2026 figures: the Ontario Living Wage Network and the Canadian Centre for Policy Alternatives' Atlantic office both published on November 9, with Vibrant Communities Calgary (with the Alberta Living Wage Network) and Living Wage BC's wage-gap analysis following shortly after. Every region they measured shows the local minimum wage falling short of the calculated living wage, by $7.40 an hour in Charlottetown, PE up to $13.00 an hour in Halifax, NS. Using the CanPay Insights tax engine to convert full-time (2,080 hours/year) earnings at each rate into actual take-home pay, the after-tax gap for a full-time worker ranges from about $10,277 a year in Charlottetown to $17,843 a year in Calgary — noticeably less than the raw hourly gap times 2,080 hours, because 27% to 36% of the extra gross pay between minimum wage and a living wage is absorbed by federal and provincial tax, CPP/CPP2, and EI before it reaches a paycheque.
Four living-wage reports, released within the same November window
Between November 9 and November 16, 2026, four independent, community-based research networks each released their updated 2026 "living wage" figures — the hourly rate they calculate is needed to cover a modest household budget in a specific Canadian city or region, before any government benefit or tax credit:
- November 9, 2026 — Ontario Living Wage Network: updated rates for all 10 Ontario regions, up an average of 1.6% from 2025.
- November 9, 2026 — Canadian Centre for Policy Alternatives, Atlantic office: "2026 Living Wages for Newfoundland and Labrador, Nova Scotia, and Prince Edward Island: Beyond Affordability," covering regions in all three provinces.
- Vibrant Communities Calgary, with the Alberta Living Wage Network: 2026 Calgary-area rate, up from $26.50 in 2025.
- Living Wage BC: a 2026 wage-gap analysis for Metro Vancouver, built on the network's $27.85/hour regional living wage.
Every single one of the roughly 20 regions these four reports cover shows the same thing: the applicable minimum wage, however recently it was raised, sits well below the calculated living wage. We took the headline rate from each report and ran it through the CanPay Insights tax engine, alongside each province's current legal minimum wage, to see what the gap is actually worth in a full-time worker's bank account.
Key findings
- The pre-tax gap ranges from $7.40/hour in Charlottetown, PE to $13.00/hour in Halifax, NS — a nearly $5,400-a-year difference in annual gross pay for a full-time (2,080 hours/year) worker, just between those two cities' gaps.
- After tax, a full-time worker's gap is smaller everywhere than the raw hourly number suggests — because tax, CPP/CPP2, and EI apply to the extra income too.
- Calgary has the largest after-tax dollar gap of the six regions checked ($17,843/year), despite Alberta's minimum wage ($15.00) being the lowest in the country and unchanged since 2018.
- Ontario's own living wage varies by more than $6 an hour inside the province, from $21.15 in the London, Elgin and Oxford region to $27.60 in the Greater Toronto Area.
The pre-tax picture: minimum wage vs. living wage, by region
| Region | 2026 living wage | Minimum wage (2026) | Pre-tax gap | Source |
|---|---|---|---|---|
| Halifax, NS | $30.00/hr | $17.00 (Oct. 1, 2026) | $13.00/hr | CCPA Atlantic, Nov. 9, 2026 |
| Calgary, AB | $26.90/hr | $15.00 (unchanged since Oct. 2018) | $11.90/hr | Vibrant Communities Calgary & Alberta Living Wage Network |
| St. John's / Eastern, NL | $27.50/hr | $16.35 (Apr. 1, 2026) | $11.15/hr | CCPA Atlantic, Nov. 9, 2026 |
| Greater Toronto Area, ON | $27.60/hr | $17.95 (Oct. 1, 2026) | $9.65/hr | Ontario Living Wage Network, Nov. 9, 2026 |
| Metro Vancouver, BC | $27.85/hr | $18.25 (June 1, 2026) | $9.60/hr | Living Wage BC, 2026 wage-gap analysis |
| Charlottetown, PE | $24.70/hr | $17.30 (Oct. 1, 2026) | $7.40/hr | CCPA Atlantic, Nov. 9, 2026 |
The after-tax picture: what the gap is actually worth
Figures below are for a single, full-time worker (2,080 hours/year, paid bi-weekly), run through the CanPay Insights tax engine with 2026 federal and provincial tax brackets, CPP/CPP2, and EI, using basic personal amounts only.
| Region | Min-wage take-home/yr | Living-wage take-home/yr | After-tax gap/yr | After-tax gap/hr | Share of extra gross pay kept after tax |
|---|---|---|---|---|---|
| Calgary, AB | $26,989 | $44,832 | $17,843 | $8.58 | 72.1% |
| Halifax, NS | $28,706 | $46,138 | $17,432 | $8.38 | 64.5% |
| St. John's / Eastern, NL | $28,109 | $43,983 | $15,873 | $7.63 | 68.4% |
| Greater Toronto Area, ON | $30,911 | $45,565 | $14,654 | $7.05 | 73.0% |
| Metro Vancouver, BC | $31,889 | $46,317 | $14,429 | $6.94 | 72.3% |
| Charlottetown, PE | $29,470 | $39,748 | $10,277 | $4.94 | 66.8% |
The last column shows how much of the extra gross pay between minimum wage and a living wage actually survives tax and payroll deductions. In the Greater Toronto Area, the raw $9.65-an-hour gap works out to $20,072 a year in extra gross pay — but only $14,654 of it, or 73.0%, reaches the worker's bank account after federal tax, Ontario tax, CPP/CPP2, and EI. Halifax shows the biggest leakage: just 64.5% of its larger $27,040 gross gap survives as take-home pay, because the jump from Nova Scotia's minimum wage to its $30 living wage pushes more of the increase into higher federal tax brackets and the CPP2 contribution band.
Ontario's own range: $21.15 to $27.60, inside one province
The Ontario Living Wage Network's November 9 update covers all 10 of its regions, not just the GTA:
| Ontario region | 2026 living wage | Gap above $17.95 minimum wage |
|---|---|---|
| Greater Toronto Area | $27.60/hr | $9.65/hr |
| Grey, Bruce, Perth, Huron & Simcoe | $24.75/hr | $6.80/hr |
| Ottawa | $24.10/hr | $6.15/hr |
| Dufferin, Guelph, Wellington & Waterloo | $23.40/hr | $5.45/hr |
| Hamilton | $23.10/hr | $5.15/hr |
| East | $22.80/hr | $4.85/hr |
| Southwest | $21.85/hr | $3.90/hr |
| Brant, Haldimand, Norfolk & Niagara | $21.60/hr | $3.65/hr |
| North | $21.35/hr | $3.40/hr |
| London, Elgin & Oxford | $21.15/hr | $3.20/hr |
Ottawa posted the largest single-region increase in the province this year, up 3% from $23.40 to $24.10, mostly attributed to rent. Every region rose from 2025, averaging 1.6% province-wide, well below 2025's 5.3% average increase.
What a living wage is — and isn't
None of these figures are legal requirements. A minimum wage is set in law by a provincial or territorial government and enforced by its labour ministry; a living wage is an independent calculation published by a community research network, with no employer obligated to pay it (some choose to anyway, and can seek "living wage employer" certification from these same organizations). The two numbers are built differently — minimum wage moves on a fixed statutory formula, usually tied to the previous year's inflation; a living wage is recalculated from an actual modest household budget (rent, food, transit, child care and similar costs) in a specific community, which is why it can shift by a different amount in every region even within the same province.
What this means for your own paycheque
If you earn minimum wage, or are negotiating a raise toward a living-wage figure for your region, plug your real hours and province into the free CanPay Insights take-home pay calculator to see your own after-tax numbers, or use the provincial calculators for Ontario, Nova Scotia, Newfoundland and Labrador, Prince Edward Island, Alberta, or British Columbia. See CPP and EI deductions on their own, or compare provinces side by side. For the minimum-wage increases that set the 2026 rates used above, see our coverage of October's five-province round of increases, Saskatchewan's October increase, and Nunavut and NWT's September increases.
Sources & disclaimer
Living-wage figures are from the Ontario Living Wage Network's November 9, 2026 regional rate update (ontariolivingwage.ca), the Canadian Centre for Policy Alternatives Atlantic office's "2026 Living Wages for Newfoundland and Labrador, Nova Scotia, and Prince Edward Island: Beyond Affordability" (policyalternatives.ca, published November 9, 2026), Vibrant Communities Calgary's 2026 living wage calculation with the Alberta Living Wage Network, and Living Wage BC's 2026 wage-gap analysis for Metro Vancouver (livingwagebc.ca) — all cross-checked against reporting from Canadian HR Reporter ("Minimum wage falls short of living wage across Canada: report," November 16, 2026), CTV News (Ottawa and Kitchener), Daily Hive, Narcity, and ToDoCanada. Minimum-wage figures match CanPay Insights' own verified rate table (scripts/minWages.ts), sourced directly to each province's labour ministry and re-checked November 1, 2026. Take-home pay figures are calculated with the CanPay Insights tax engine using 2026 federal and provincial tax brackets, CPP/CPP2, and EI, for a single full-time worker (2,080 hours/year) with basic personal amounts only — real paycheques vary with credits, benefits, RRSP contributions, and actual hours worked. This is general information, not financial or tax advice.
Calculate Your Take-Home Pay
Enter your salary and province to see detailed tax breakdowns instantly.
Use Free CalculatorFrequently Asked Questions
What is a "living wage" and how is it different from the minimum wage?⌄
Which region had the biggest gap between minimum wage and living wage in the new 2026 reports?⌄
What does the gap look like after tax, using the CanPay Insights tax engine?⌄
Why is the after-tax gap smaller than the raw hourly gap multiplied by 2,080 hours?⌄
Are these living-wage figures the same as official government minimum-wage rates?⌄
Does Ontario's living wage vary a lot by region?⌄
Share this article
Help others learn about Canadian taxes
Disclaimer: This content is based on publicly available information and general tax knowledge for reference only. Individual tax situations may vary. Please consult a qualified tax professional or accountant for personalized advice.