Quick Answer
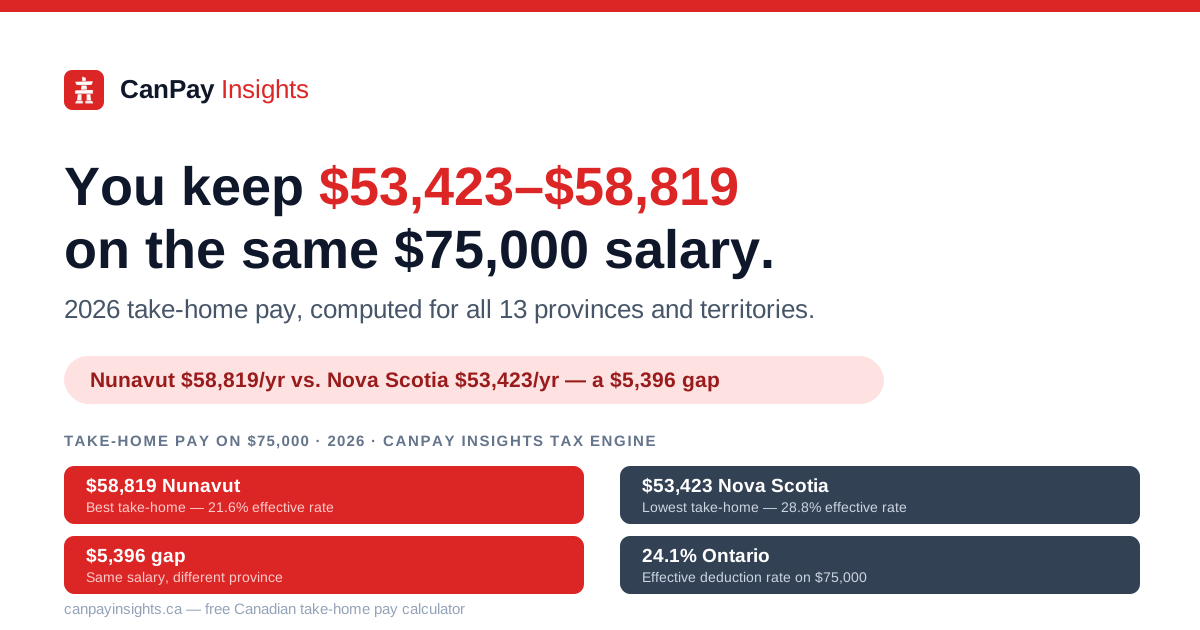
A $75,000 salary nets between $53,423 (Nova Scotia) and $58,819 (Nunavut) after federal tax, provincial tax, CPP/QPP, and EI in 2026 — a $5,396 gap driven almost entirely by provincial income tax. Ontario nets $56,926 a year ($4,744 a month), British Columbia $57,711, Alberta $57,362, and Quebec $53,965. These are CanPay Insights’ own 2026 calculations, from the same tax engine checked row-by-row against the CRA’s payroll deduction tables.
A $75,000 salary is not the same paycheque everywhere
Gross pay of $75,000 looks identical on an offer letter no matter where in Canada the job is. What lands in the bank account does not. We ran that exact salary — single filer, no other income, bi-weekly pay — through the CanPay Insights tax engine for all 13 provinces and territories, the same engine checked row by row against the CRA's T4032 payroll deduction tables before every release.
2026 take-home pay on $75,000, every province and territory
| Rank | Province | Take-home / year | Take-home / month | Federal tax | Provincial tax | CPP/QPP + EI | Total deductions | Effective rate |
|---|---|---|---|---|---|---|---|---|
| 1 | Nunavut | $58,819 | $4,902 | $8,259 | $2,553 | $5,370 | $16,181 | 21.6% |
| 2 | Northwest Territories | $57,763 | $4,814 | $8,259 | $3,609 | $5,370 | $17,237 | 23.0% |
| 3 | British Columbia | $57,711 | $4,809 | $8,259 | $3,661 | $5,370 | $17,289 | 23.1% |
| 4 | Yukon | $57,655 | $4,805 | $8,259 | $3,717 | $5,370 | $17,345 | 23.1% |
| 5 | Alberta | $57,362 | $4,780 | $8,259 | $4,010 | $5,370 | $17,638 | 23.5% |
| 6 | Ontario | $56,926 | $4,744 | $8,259 | $4,446 | $5,370 | $18,074 | 24.1% |
| 7 | Saskatchewan | $55,806 | $4,650 | $8,259 | $5,566 | $5,370 | $19,194 | 25.6% |
| 8 | New Brunswick | $55,102 | $4,592 | $8,259 | $6,270 | $5,370 | $19,898 | 26.5% |
| 9 | Manitoba | $55,024 | $4,585 | $8,259 | $6,348 | $5,370 | $19,976 | 26.6% |
| 10 | Newfoundland and Labrador | $54,737 | $4,561 | $8,259 | $6,635 | $5,370 | $20,263 | 27.0% |
| 11 | Prince Edward Island | $54,316 | $4,526 | $8,259 | $7,056 | $5,370 | $20,684 | 27.6% |
| 12 | Quebec | $53,965 | $4,497 | $6,856 | $8,466 | $5,714 | $21,035 | 28.0% |
| 13 | Nova Scotia | $53,423 | $4,452 | $8,259 | $7,949 | $5,370 | $21,577 | 28.8% |
The spread between the best and worst outcome on an identical salary is $5,396 a year — about $450 a month — between Nunavut and Nova Scotia.
Why the gap is almost all provincial tax
Look down the federal tax column and it barely moves: $8,259 in every province except Quebec. CPP and EI barely move either, at $5,370 everywhere except Quebec. The entire $5,396 spread between the best and worst province comes from provincial income tax, which ranges from $2,553 in Nunavut to $7,949 in Nova Scotia — a more than threefold difference on the same income.
The three territories and British Columbia take the least, because their tax brackets and basic personal amounts are more generous at this income level. Atlantic Canada and Quebec take the most, because their provincial brackets climb faster.
Quebec is a special case
Quebec workers pay $1,403 less federal tax on $75,000 than everyone else ($6,856 instead of $8,259) — the federal abatement that exists because Quebec runs its own parental insurance (QPIP) and collects its own pension contributions (QPP) instead of relying entirely on federal programs. Quebec residents also pay $344 more into CPP/QPP and QPIP combined than the rest of Canada ($5,714 versus $5,370).
None of that saves Quebec workers money overall: provincial tax in Quebec is the highest in the country at $8,466 on a $75,000 salary, more than enough to offset the federal discount. Net result: $53,965 take-home, second-lowest in Canada.
What this does and doesn't tell you
This is a single, deliberately plain scenario — one income, no RRSP contribution, no dependents, no other credits — so the 13 numbers are directly comparable to each other. Your own take-home pay will differ if you contribute to an RRSP, claim other credits, or have a different pay frequency. Cost of living also varies enormously between, say, Nunavut and Nova Scotia, so the province that keeps the most of your paycheque is not automatically the one where it goes furthest.
How we calculated this
Every figure above comes from CanPay Insights' own 2026 tax engine — the same engine whose output is checked, row by row, against the CRA's T4032 payroll deduction tables (claim code 1, bi-weekly) for all 13 jurisdictions, plus the CRA's CPP/EI tables and Revenu Québec's source deduction tables, before any release. Figures are rounded to the nearest dollar. To see your own numbers with your actual salary, deductions, and pay frequency, use the free take-home pay calculator, or jump straight to your own province: Ontario, British Columbia, Alberta, Quebec, Manitoba, Saskatchewan, Nova Scotia, New Brunswick, Newfoundland and Labrador, Prince Edward Island, Yukon, Northwest Territories, or Nunavut. For a breakdown of CPP and EI specifically, see the CPP/EI calculator and EI Premium Rate for 2027. This is general information, not financial advice.
Calculate Your Take-Home Pay
Enter your salary and province to see detailed tax breakdowns instantly.
Use Free CalculatorFrequently Asked Questions
How much is $75,000 after tax in Ontario?⌄
Which province keeps the most of a $75,000 salary?⌄
Which province takes the most tax from a $75,000 salary?⌄
How much CPP and EI do I pay on a $75,000 salary?⌄
Why is federal tax lower in Quebec but take-home pay still the lowest?⌄
What is the gap between the best and worst province on the same salary?⌄
Share this article
Help others learn about Canadian taxes
Disclaimer: This content is based on publicly available information and general tax knowledge for reference only. Individual tax situations may vary. Please consult a qualified tax professional or accountant for personalized advice.